Total Column Ozone, zonal mean
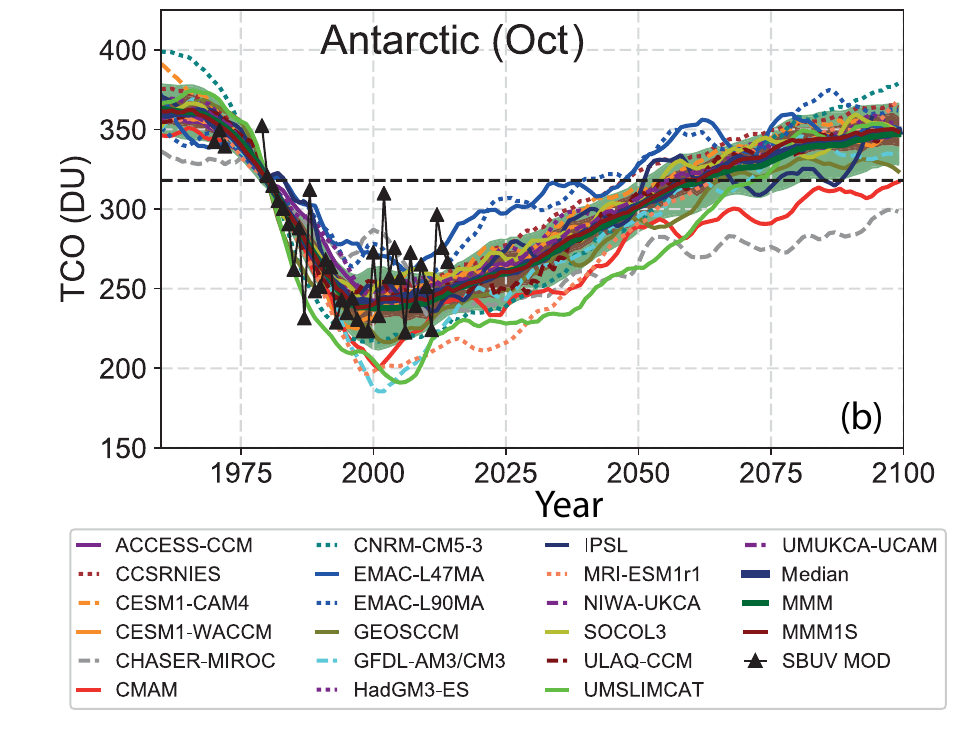
Total column ozone time series for Antarctic in October from 19 individual CCMs for the REF-C2 simulations with respect to mean 1980–1984 observations. The dashed black line indicates 1980 reference value. Credit: S.S. Dhomse et al., Atmos. Chem. Phys., 18, 8409–8438, 2018
The model results for the ozone data can come in different units, like volume or mass mixing ratios, partial pressure, number densities or ozone density. Those units can be converted into each other:
Conversions of ozone volume mixing ratio (vmr) into common other units:
The volume mixing ratio is given in ppmv (parts per million, 10-6,) pressure in hPa and temperature in K, then:
Ozone partial pressure pO3 [nbar]:
pO3 = vmrO3 × pressure
Ozone density ρO3[μg/m3]:
ρO3 = vmrO3 × 577.3 × pressure / temperature
Ozone mass mixing ratio mO3 [μg/g]:
mO3 = vmrO3 × 1.66 (mol_m_O3/mol_m_air = 48/28.9)
Ozone number density NO3 [molecules/cm3]:
NO3 = vmrO3 × pressure / (1.38 × 10⁻¹⁹ × temperature)
Also all these units can be converted to ozone volume mixing ratio (vmr) can be converted by inverting the above equations: The volume mixing ratio is given in ppmv, pressure in hPa and temperature in K.
Ozone partial pressure pO3 [nbar]:
vmrO3 = pO3 / pressure
Ozone density ρO3 [μg/m3]:
vmrO3 = ρO3 × 1.7322 × 10-3 × temperature / pressure
Ozone mass mixing ratio mO3 [μg/g]:
vmrO3 = mO3 × 0.602
Ozone number density NO3 [molecules/cm3]:
vmrO3 = NO3 × 1.38 × 10-19 × temperature / pressure
(http://www.meteo.mcgill.ca/hydroxyl/wiki/doku.php?id=ozone from Thilo Erbertseder, Frank Baier, last modified: October 2005)
Once ozone number density values are calculated, the values can be integrated over all heights to get a total column of ozone. Often the integration is done only partially either over the heights in the troposphere (from the ground to the tropopause) to get a tropospheric partial column of ozone or over the heights of the stratosphere (from the tropopause to the top of the atmosphere) to get a stratospheric partial column. The unit most often used for the column values of ozone is the Dobson unit:
1 Dobson Unit (DU) is:
2.6867 × 10+20 molecules per square meter
4.4615 × 10-04 mol per square meter
2.1415 × 10-05 kilogram of ozone per square meter
Also, a Dobson Unit can also be seen as a measurement of thickness of the ozone column: A typical column amount of 300 DU of atmospheric ozone corresponds to a 3 mm layer of pure gas at the surface of the Earth.
It can be seen that the integration over altitude in m could be done over those other units (mol, kg) as well, instead of only the number densities.
Often we deal with large data sets. Since we are interested mainly in the latitudinal distribution of ozone zonally (E-W direction) averaged values of ozone can be used.
Now we have reduced the 4 dimensional dataset (time, latitude, longitude and altitude) into a two dimensional dataset (time, latitude) by first integrating over the altitudes and then taking the zonal mean across the longitudes. Of these values time series can be plotted to see the trend in future ozone over different latitude bands.